Scottish Divergence: COVID-19 and Scottish Independence a Twitter Analysis

By Callum Duffy

During the pandemic, we found that a pro-independence stance in the public twitter discourse was strongest at points of significant policy deviation by the Scottish government from the U.K. government position (easing lockdown slower, entering a circuit breaker quicker). Our analysis of commonly used words also revealed that Brexit remained a highly motivating issue, particularly for users expressing a pro-independence stance. The contrast between the Scottish Government’s handling of the pandemic and that of the UK government is cited by pro-independence tweeters as a reason for supporting independence.

Methodology: We used Tweets from the Edinburgh’s COVID-19 tweet database. This is a set of all of the tweets produced that are categorised by Twitter as containing COVID-19-related information. Access to this dataset is provided in an ongoing fashion by Twitter from March 2020 as a response to the pandemic and granted to selected institutions.

To select tweets that refer specifically to Scottish Independence, we searched for tweets that contained keywords that indicated discussion around Scottish Independence. These terms were (normalised for case) indyref, indyref2, scottish referendum, scottish independence, independent scotland, scexit, scottish nationalism, and yesscotland. These keywords were identified using a random sampling of the tweets from leading figures in the 2021 Scottish Parliamentary Elections. Certain keywords/phrases (e.g. bettertogether) had to be discarded as, on manual inspection, those phrases were found to refer more often to non-independence issues.

Tweets were gathered across 6-week long periods, with each period starting on a Monday:

First 16th of March, 2020 This week contained the start of the national U.K. lockdown
Second 11th of May, 2020 First Minister Nicola Sturgeon announced Scotland would diverge from England as it exited lockdown
Third 8th of July, 2020 The Scottish Government announced that travellers returning from Spain and Serbia would be required to quarantine on arrival to Scotland, a divergence from the policy of the UK Government
Fourth 2nd of November, 2020 England entered a 4-week lockdown at the same time Scotland exited a 3-week lockdown
Fifth 16th of December, 2020 The Scottish government backtracked on a previous 4 nations agreement over Christmas rules, electing to change those rules and to announce a return to lockdown
Sixth 16th of March, 2021 A year on from the first lockdown. Taken to determine what extent the conversation surrounding Scottish Independence and COVID-19 had changed

We recorded the overall volume of the conversation surrounding Scottish independence. Then 99 tweets from each period were randomly sampled to ensure that results were statistically significant but that the sample size in each period remained constant. These selected tweets were manually annotated for Independence stance, for whether they expressed a view that was supportive/positive, against/negative, or neutral.

Results and Analysis

Overall, over 3,625 tweets were published during the 6 periods examined for this dataset. As shown in Figure 1. The low volume of tweets during periods 1 and 2 (59 and 159 respectively) suggest that, before major policy divergences between the UK and Scottish governments, Scottish independence did not factor heavily into the online discussion surrounding COVID.

The third, fourth, and fifth periods, saw far higher numbers, with 703, 592, and 939 respectively. All three of these periods coincide with periods of increased restrictions from the Scottish Government that ran counter to the U.K. Government’s approach. These periods, which displayed a heightened difference between the two Governments on the pandemic, saw a, 269%, 442%, and a 159% increase respectively in constitutional discourse about the pandemic from their prior periods.

Finally, the sixth period saw the highest number of tweets, with 1,172 being published. While this could have been heavily influenced by the impending election, it may also suggest that the events of the previous year had led to Scottish Independence entering the COVID-related discourse in a significant way.

As shown in figure 2. The volume of pro-Independence tweets is strongest at points of significant policy deviation by the Scottish government from the U.K. government position (easing lockdown slower, entering a circuit breaker quicker). We found, when analysing commonly used words, that Brexit also remained a highly motivating issue, particularly for users expressing a pro-independence stance. The Scottish Government’s handling of the pandemic in contrast to the UK government’s is cited by pro-independence tweeters as a reason for supporting independence.

Below are the main points of focus in the twitter discourse for each group during each period.

Period Anti-independence Pro-independence
First The suspension of Independence campaigning The “divisiveness” of the Boris Johnson government
Second Criticism of Scottish Government pandemic policies Praise of Scottish Government pandemic policies and criticism of U.K. Government policies
Third Criticism of how an Independent Scotland would have dealt with pandemic economics Criticism of U.K. Government policies and criticism of Nicola Sturgeon not arguing for independence
Fourth Criticism of Nicola Sturgeon’s leadership Discussion of lack of powers surrounding the furlough scheme
Fifth Discussion of hypothetical business support in an independent Scotland and criticism of Nationalists desire for a referendum Brexit deadline and arguing for Scottish Government control of Scottish borders
Sixth Criticism of the Independence Referendum Bill Accusations of dishonesty from Nicola Sturgeon regarding Covid-19 and Alex Salmond, arguments suggesting the necessity of independence for Covid-19 recovery

The most significant support for independence was seen during the periods where policies by the Scottish Government (the first public divergence in period 2 and the English lockdown in period 4) highlighted divergence. Periods that saw less dramatic divergence, such as slight alterations to the travel corridor and Christmas easing rules in periods 3 and 5 saw anti-independence sentiment rise. This suggests that divergence was a motivating factor in driving independence-related Covid-19 discourse, but those in favour of independence were more motivated by more significant moments of divergence.

Both pro and inti-independence tweeters framed their arguments around perceptions of the then First Minister Nicola Sturgeon and the Scottish Government’s handling of the pandemic. During the coding of tweets it was observed that tweets expressing pro-independence sentiment furthered the argument that both First Minister Sturgeon and the Scottish Government had made better policy decisions than the U.K. Government. Tweet’s expressing anti-independence sentiment claimed a lack of competence, but were far more likely to refer specifically to the First Minister rather than the Scottish Government, suggesting they viewed Government policy as more closely tied to her personal brand. These tweets also make the case that the pandemic would have been worse had Scotland voted for independence in 2014.

The arguments from both camps are built around comparisons. For the pro-independence side, comparing the current U.K. Government to the current Scottish Government. For the anti-independence side, comparing the current Scottish Government to a hypothetical independent Government.

Ten Things We Learned about Fusion Teaching — Reflections on the first EFI Fusion Course

By Bea Alex, Pawel Orzechowski, Martin Hawksey and Clare Llewellyn

This week we ran our two-day intensive course on Text Mining for Social Research as part of the Future Government MSc programme offered by the Edinburgh Futures Institute (EFI). This is a fusion course meaning it’s taken by students and professionals at the University of Edinburgh, some located in the teaching room on campus and others from their homes and offices around the world.  Our course is the first fusion course being piloted this semester and here we report on what we learned during the two intensive days working with the students joining us physically and virtually in the fusion classroom.

  1. Why fusion? 

Why would anyone run a fusion course? Shouldn’t we just run two courses: Online and onsite? Surely there are different people attending these courses who actually want to learn differently? Would we actually be doing a disservice to both parties? We found that it gave us and the students access to more amazing people. There was a diversity of participants who benefited from the experience of others. The course was designed around pair programming so the group quickly got to know each other and which helped to reduce any physical or perceptual barriers.  Students worked together, they shared their screen and connected to the large screens in the onsite classroom, and they talked — probably more than they would have in a traditional classroom.  The student feedback, collected regularly over the two days, shows that most students enjoyed the fusion nature of the course. 

2. The biggest problem will be video … it wasn’t

We thought no one would turn on their video and if they did the video would be pixelated and glitchy. We worried about how the online students would see us in the room and about whether we would end up focusing on the online students at the expense of those onsite. But actually this wasn’t an issue. We had three cameras set up, one on the presenter desk, one showing the front of the room and one showing the entire classroom from the back. Students, maybe because of the pandemic, have adapted to this kind of online interaction. Bandwidth seemed to be a non-issue. Some students had their cameras on and some didn’t. The REAL problem was the audio. We established early that the onsite students had to have speakers and microphone off when they moved from group discussion in break-out rooms back into the main room otherwise – the feedback was awful (squeeeeeek). The students did a really great job at this. The lecturers sometimes struggled. Despite this issue, ironically the audio for online students was sometimes better than for the onsite students, the combination of lapel and intelligent ceiling mics removing background noise in the room for those listening online. 

3. Pair programming is something that benefits the less able students and the more experienced won’t like it … again not true

We found that the students launched straight into working together in a manner we didn’t expect even across the online-onsite modality. In some ways this was easier than in the onsite-only modality. Why find an HDMI cable when you can just share a screen? We watched students talk to each other through code and spot each other’s errors. The more experienced students said they benefited from explaining how something works — you only know something when you can explain it to somebody else. When we use pair programming in our teaching there are always a small number of people who would prefer to work on their own but overall we got very positive feedback on it.  One student commented that “pair programming is super useful, (especially for someone like me, with no coding experience)” another liked the “vastly different backgrounds of participants”.

4. Masks were not a problem

We decided really early on that if the students had to wear masks, so did the teachers. We did worry that this would enforce a barrier and muffle audio. This just seemed to be a non-issue. Within seconds we forgot we had masks on and the audio was crystal clear.  We realise that some students may benefit from lip reading when following a lecture so all our taught material is also recorded and made available with subtitles.

5. Everyone has and will bring hardware (earphones, hdmi-to-laptop connectors) … nope

They didn’t even when we had this obviously indicated in the pre-course notes. Luckily we had anticipated this and had lots of spares. By day two of the intensive all on-campus students brought their own headsets. HDMI adapters were however still an issue and we assume those who did not bring them just didn’t have them. 

6. Fusion is much less challenging than you might expect

Being asked to teach students coding, data manipulation and text mining in two days might seem ambitious. Teaching students in a fusion fashion, online and onsite, across time zones stretching from the USA to Cambodia, those who are students or professionals, who may be coding literate and coding novices might seem insane. But careful preparation, experience and extremely good tech can make it not only possible but really good fun. We found that this kind of course lends itself well to a fusion style of teaching but the multitude of tasks and student support involved would make it challenging to be run by a single lecturer on their own.  This is also true if teaching it solely to students on campus.

7. You need to be very explicit about the course content and timetable

Providing a consistent “badge” structure and message for teaching, the same structure for every new piece of content, reiterating the timetable throughout the day, telling students every single time how they could interact with the technology and with us took away the cognitive load from the students and the necessity for one-to-one guidance, thereby allowing us to focus on the teaching and learning.  

8. You can only learn one new thing at a time

This strangely didn’t seem to be a big problem for the students, but it was for the lecturers. The students learned how to use the tech, how to work with data, how to code, and the fundamentals of text mining with ease. The lecturers had to deal with the new environment and the physicality of teaching onsite and online, coping with the multiple modalities all at once was hard. If we hadn’t known our content inside out this may have been difficult.  It took us the morning session of day one to get settled into the level of multitasking needed for fusion teaching.  After that our running of the course felt a lot more settled to us.

9. Students loved the flexibility more than we expected

We had students who were due to be online requested ahead of time to be there in person. Their motivation to be involved became infectious and improved the class. Students who had unforeseen circumstances, illness, meetings, caring responsibilities, work responsibilities, other class clashes, were still able to work around and be active members of the class.  One student, for example, swapped between the onsite and online modality at the last minute due to her other commitments. This flexibility and the structure of the course in badges, meant that it felt inclusive and adaptable.

10. Students are way more forgiving than you may imagine

The secret of the way that we teach is that there are no secrets. If there was a slight teething issue we owned it, and talked through what we were doing to fix it. If there was an error on the slides or in the code we used it as a teaching opportunity. Solutions and questions were posed in the chat and one of the lecturers constantly monitored that.  This helped all students to feel included and part of the environment.

In summary, we have had a positive experience teaching the intensive fusion course and are looking forward to making adjustments based on what we learned when we teach the course again next year when EFI will officially launch its new post graduate programme

Beatrice Alex, Senior Lecturer and Chancellor’s Fellow, School of Literatures, Languages and Cultures, EFI

Pawel Orzechowski, Lecturer in Programming for Business, Business School

Martin Hawksey, Learning Design and Technology Lead, EFI

Clare Llewelly, Career Development Fellow at School of Social and Political Science

Who did Twitter users blame for Brexit?

by Izaak Gilchrist, Q-Step Intern, Neuropolitics Research Lab

Much of the acrimonious debate on Brexit of the past few years played out on Twitter. But the sheer volume of Tweets on the subject, and the oft-cited ‘echo chamber’ phenomenon make it difficult to gauge what this conversation looked like. What kind of messages were prominent on Twitter? Which side of the Brexit debate was strongest? How did this change over time? How were Theresa May and Boris Johnson judged in their tenure as prime minister?

Over the past several weeks our team in the University of Edinburgh’s Neuropolitics Research Lab has been working to answer these very questions, drawing on a unique dataset of over 500 million Tweets obtained during the Brexit process in order to conduct original research on the role of Twitter in the debate.

We analysed nine ‘spikes’ in the data which was collected between June 2017 and January 2020, where Brexit-related activity on Twitter flared. Spikes were identified as those days where the number of tweets related to Brexit exceeded 75,000 tweets. Where two or more 75,000 tweet days occurred within 7 days of each other, we allocated these to the same spike.

We extracted the top 100 most retweeted tweets from our spikes. Each of these would be coded as pro, anti, or neutral on Brexit.  They would then be sorted into one of 15 categories related to the Brexit deal. Each of these categories could be referred to by the tweeter in a positive, negative, or neutral way, producing a three-level coding system for each tweet.

Using these nine spikes to paint a picture of the Twittersphere and how they were reacting to the Brexit debate over time, we discovered that the sentiment on Twitter is mainly negative towards Brexit. This feeds into the narrative that Twitter is a reactionary platform, where opinions are rarely published by those that are happy with the status quo.

The most anti-Brexit spike appears to occur between the 12th and 14th of March 2019. Events that occurred during this spike included Second Meaningful Vote, the ruling out of no deal by Parliament and Parliament asking the Government to delay Brexit. These events contributed to Theresa May’s resignation in the Summer of 2019.

The number of anti-Brexit tweets dwarfed the pro-Brexit tweets in this period, as can be seen in Figure 1. Anti-Brexit tweets were 5.5 times more common than pro-Brexit tweets. Even neutral tweets on the subject received more retweets on Twitter than pro-Brexit tweets.

Figure 2 shows that the popularity of anti-Brexit tweets during this period is fuelled by the huge intensity of tweets about a second referendum (or People’s Vote). Figure 3 illustrates this in more detail, showing the mood of each tweet on the likely outcome of the deal. From Figure 3, we can see that tweets referring to a second referendum were largely positive, meaning they were generally anti-Brexit.

Most likely the salience of the second referendum increased owing to the gridlock in Parliament over the Brexit deal. Lots of tweeters suggested that this was the only way to progress (or regress) from this stage of the Brexit process. Thus, the political crisis in Brexit would seem to have contributed to the popularity of the second referendum in this period.

The most pro-Brexit spike occurred on December 13th 2019 as the results of the 2019 General Election were being revealed. Boris Johnson and the Conservative party had won a big majority with their pro-Brexit manifesto. Additionally, Jeremy Corbyn resigned as leader of the Labour Party, which had pledged to offer a second EU referendum should they win the Election.

This was the first and only time that the number of pro-Brexit tweets outnumbers the anti-Brexit ones. This perhaps shows that even the pro-remain Twitter discussion was related to the realisation that Brexit was inevitable by this point. Figure 5 shows that those tweeting about Brexit were reflecting upon its changes to British society and making statements about the PM and the Government. According to Figure 6, many of these tweets on these two subjects were positives. This shows that both Boris Johnson’s actions as Prime Minister and Brexit were now viewed, at least on Twitter, in a positive light.

However, this must be prefaced with the fact that it is just one day, occurring the day after the biggest election defeat for the Labour Party in 84 years. Thus, it can be expected that supporters of this party, often vocal supporters of remain, would be quiet on social media on this day.

When we compare the data across time, we can get a sense of the relative popularity of leaders and how this changed during the Brexit process. Figure 7 shows the number of tweets in each spike that have been categorised as making a statement on the current Prime Minister or Government. These tweets have been split into negative, positive, and neutral sentiments. Theresa May’s premiership ended on the 24th of July 2019. This means that she was in charge for the first 6 spikes (her last spike being the 27-29th March 2019). Boris Johnson’s premiership is reflected in the last 3 spikes analysed.

Interestingly, only one positive tweet about May’s leadership was recorded. This would suggest that May’s approach to Brexit was widely disapproved of in the Twittersphere. This was reflected in reality, as May was constantly under pressure from her party and the public. Indeed, May was not trusted by Leave MPs and voters to deliver the best form of Brexit and was disliked by Remain MPs and voters for pushing a harder Brexit than many expected.

And yet there is a downward trend in the negativity towards May’s leadership as the Brexit timeline progresses. This could reflect the gradual realisation that Brexit was becoming an increasingly impossible task, and that May was caught up in a very challenging situation politically.

Judging by the way May was received, we would expect Johnson to be especially loathed by Remain supporters and fully embraced by Leave supporters. This supposition is supported by the data, with Johnson receiving both the highest negativity during the 28th of August 2019 spike and the highest positivity in the 13th of December 2019 spike. It could be argued that Johnson’s growing approval on Twitter is recognition of him doing well and delivering Brexit, something his predecessor failed to achieve.

Others may argue that Brexit-related narrative on Twitter , and the public more broadly, were becoming fatigued by their criticism of the Prime Minister, since it clearly and no impact on his agenda. As the graph above shows, Remain voices became quieter as the Brexit process became more ‘inevitable’, and leave voicers became louder as they saw what they voted for in 2016 finally becoming a reality.

In sum, we can see that the Twitter debate on Brexit tended to have a Remain bias during the Brexit negotiation process. The stance toward Brexit became softer towards the end of the Brexit negotiation process. By the end of this analysis, discussion had become largely pro-Brexit, arguably reflecting the public mood of satisfaction with Johnson among Leave supporters and grudging recognition of the realities of Brexit in the Remain community.

UK General Election 2019: A Twitter Analysis


We have analysed the top used hashtags for the final month of the GE2019 campaign. Here we take a quick look at these preliminary results and contrast them with a similar analysis we conducted for GE2017.

The graph shows the top hashtags grouped by topic. We did this by taking the most used 100 hashtags and grouping them into topics. The pie chart we present the top 20 topics.

Our data set shows an overwhelming dominance of pro-Labour tweeting. Labour party coverage out performs Conservative coverage by almost three times both in 2017 and 2019. There is a disproportionate presence of the SNP (2% in 2017 and 1% in 2019) in this social media set and given that only Scottish voters can elect this party this is striking, but the percentages are down from 2017 levels.

Most striking in this data set is the overwhelming dominance of Labour tweeting. Tweets using hashtags do not necessarily indicate support but do highlight areas of discussion.

There are 1% of tweets employing and anti-Corbyn hashtag but none employing an anti-Labour hashtags. Anti-Johnston stands at 2% and get the Tories out is at 5%.

In 2019 Corbyn hashtags (5%) outperform Johnston hashtags (4%). Although this difference is less stark than in 2017 between May and Corbyn. Tactical Voting appears (4%) in 2019, a new topic not seen in 2017.

Brexit has increased in popularity from 2017 (8%) to 2019 (10%) and the NHS has stayed roughly the same (4%).

There does seem to be a degree of decreased voter engagement in using hashtags about political TV and Radio programmes and the political debates which are well down on 2017 levels.

Tweeters are typically highly motivated and perhaps those who initially see themselves as the underdogs in the debate, excluded from mainstream coverage. This has been apparent in a number of recent campaigns. The YES campaign, though ultimately unsuccessful, dominated social media in the Scottish independence referendum. Leave groups did the same in the 2016 Brexit campaign and Trump’s dominance in social media transformed US election coverage, with both these campaigns ultimately triumphing at the polls. This also fits with the high presence of the SNP in our data set, with the Scottish debate marginalised at the UK level. If the current polling is to be believed Jeremy Corbyn is unlikely to do as badly as was anticipated when the election was first called.

By Clare Llewellyn (clare.llewellyn@ed.ac.uk)

Volunteers needed for a behavioural study!

Hello,

We would like to invite you to volunteer for our behavioural study at NRlabs!

This study, on healthy volunteers, is about how people perceive and understand information on social media. You will perform a self-paced reading-based interactive experiment which will take up to an hour. You will receive £10 out of pocket expenses for participation in this study.

We are looking for volunteers who are:

  • 18 – 45 years of age
  • Have no current psychiatric illness or medications relating to cognitive function
  • Native English speakers with no difficulty to read online text
  • UK Citizen

The experiment will take place in the Neuropolitics Research Lab, 18 Buccleuch Place, EH8 9LN, Edinburgh. Any questions please contact Sujin.hong@ed.ac.uk

If you are interested in taking part in this study, please fill the below survey:

https://edinburgh.eu.qualtrics.com/jfe/form/SV_7WIICIt5gcm9nGB

We find Brexit-related Tweets from Twitter’s list of suspected Russian troll accounts

We have been collecting Twitter data on the UK-EU Brexit referendum since August 2015 and we currently have over 62 million Tweets. We collect data in several ways but the data set we discuss here is gathered using a variety of brexit related hashtags.

Twitter released a list of user names and id numbers of 2,752 Twitter accounts that the company identified as being related to Russian troll activity relating the US 2016 election.

We searched within our data set for signs of activity from these accounts. We found 3468 tweets from 419 users on this list. 400 of these tweets were on the date of the EU-referendum, 23rd June 2016 and were from 38 users. 432 were in the week of the referendum from 58 users.

We also took a look at the user defined location field in these tweets. Some have no location specified (127) but of those that do most (370) say they are from the USA (America, USA, US, state names, cities, towns). Only three of the users we find say they are from the UK.

Many of the tweets actually came after the EU-referendum polls closed — 78%. Only 776 tweets were before 23rd June 2016 10pm BST.

We found that 59% of the tweet text started with ‘rt’ and are therefore likely to be retweets. This leaves 41% that is not a direct retweet and may be original content.

We are confident that our findings are a conservative estimate of the activity of the 2752 accounts identified by Twitter as problematic. We have an automated process in place for deleting archived tweets when Twitter send out a request to do so. Typically when they suspend or delete accounts (as they have with this list) this is what Twitter do. We may, therefore, already have deleted relevant data from our archive. Also we only collect the allowed sample of free data from Twitter for our research. So although we have over 62 million tweets collected, we will not have captured all of the activity by these users.

Caution, however, needs to be exerted when trying to assess the influence of these users in relation to Brexit. First, the numbers, even if conservative, are relatively small. 3468 tweets out of 62 million in our data set came from 419 users on Twitter’s list of 2752 suspect accounts. Second most (78%) of the tweeting using Brexit-related hashtags that we find, took place after the date of the referendum.

On the other, hand, we should not assume that there was no influence either. We know, for example,  that some of these users had high numbers of followers. More nuanced data is needed on what happened to these 3468 tweets. How often were they retweeted for example?

It is important to remember that when searching for the users on the Twitter list, we are examining the behaviour of users identified as having attempted to disrupt the US election. It is perhaps, unsurprising that those tweets that appear in our Brexit-related data set post-date the referendum. Although these users are using Brexit-related hashtags, we cannot say whether they were primarily trying to influence Brexit itself or whether Brexit was simply an issue recognised as disruptive, or as amplifying issues around immigration and free trade blocs that resonated in US election debate.

The significance of these findings is that they provide the first hard evidence that users identified by Twitter as having Russian links and as seeking to influence the US election, were also actively tweeting on Brexit-related issues. To establish the extent to which the Brexit debate, or indeed the UK general election, were influenced by such users we need an equivalent list of users seeking to target these specific events and a complete data set. This would allow more nuanced analysis of the level, type and significance of activity and influence to be assessed. This is an issue of vital public interest but the much needed detail is in danger of being lost in the hype surrounding this issue.

This blog is written by Clare Llewellyn and Laura Cram of the Neuropolitics Research Lab from the University of Edinburgh. The project is part of the UK in a Changing Europe programme and is funded by the ESRC.

General Election 2017: a Twitter Analysis

Introduction

This work is produced by researchers at the Neuropolitics Research Lab, School of Social and Political Science and the School of Informatics at the University of Edinburgh. In this report we provide an analysis of the social media posts on the British general election 2017 over the month running up to the vote. We find that pro-Labour sentiment dominates the Twitter conversation around GE2017 and that there is also a disproportionate presence of the Scottish National Party (SNP), given the UK-wide nature of a Westminster election. Substantive issues have featured much less prominently and in a less sustained manner in the Twitter debate than pro and anti leader and political party posts. However, the issue of Brexit has provided a consistent backdrop to the GE2017 conversation and has rarely dropped out of the top three most popular hashtags in the last month. Brexit has been the issue of the GE2017 campaign, eclipsing even the NHS. We found the conversation in the GE2017 Twitter debate to be heavily influenced both by external events and by the top-down introduction of hashtags by broadcast media outlets, often associated with specific programmes and the mediatised political debates. Hashtags like these have a significant impact on the shape of the data collected from Twitter and might distort studies with short data-collection windows but are usually short-lived with little long term impact on the Twitter conversation. If the current polling is to be believed Jeremy Corbyn is unlikely to do as badly as was anticipated when the election was first called. Traditional media sources were slow to pick up on this change in public opinion whereas this trend could be seen early on in social media and throughout the month of May.

Data Collection

A set of 56 keywords related to the British general election in 2017 (GE2017) was used to collect tweets on the topic. The Twitter streaming API was used to retrieve tweets containing any of these keywords between the April 29, 2017 and June 4, 2017. The keywords consists of hashtags, accounts, and terms representing phrases on the elections (e.g. #GE2017, general elections), politicians involved in the elections (Theresa May, Corbyn, #jc4pm), and related topics (e.g. Brexit, NHS).

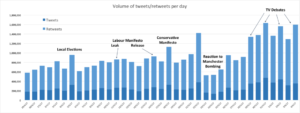
During the period of study, over 34 million posts were collected, where 9.6 millions are tweets and 25 million are retweets. Figure 1 illustrates the volume of tweets/retweets collected daily during the period of study.

Figure 1. Distribution of the collected tweets/retweets over the period of study

Analysis

As shown in Figure 1, the number of posts collected per day, there is clear evidence of the event driven nature of the Twittersphere. As well as observing a rise in the overall number of posts related to GE2017 over the month, peaks in the data can readily be associated with events such as the 5 May local elections and the Manchester bombing (with an associated drop in GE2017 posting as the campaigns paused in its aftermath). Interestingly, the official release of the Labour manifesto did not produce a significant spike in overall Twitter posts, perhaps due its earlier leaking. However, as can be seen in Figure 4, it did enjoy two mini boosts (becoming one of the top three most used hashtags on the day of its leak and again on the day of its official launch). On 18 May the Conservative manifesto launch coincided with the ITV leaders’ debate, producing a significant Twitter boost. Analysis of hashtags used, in Figure 4, indicates that the Conservative manifesto launch was indeed the larger contributor to this boost. As we are approaching the June 8 election date, Twitter traffic is evidently increasing. However, the increasingly event driven, and often top-down, shaping of the conversation is striking. Spikes in the Twitter data are closely linked with major media events and TV debates and, as we can see in Figure 4, are strongly influenced by the official hashtags promoted by the media companies.

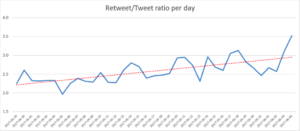
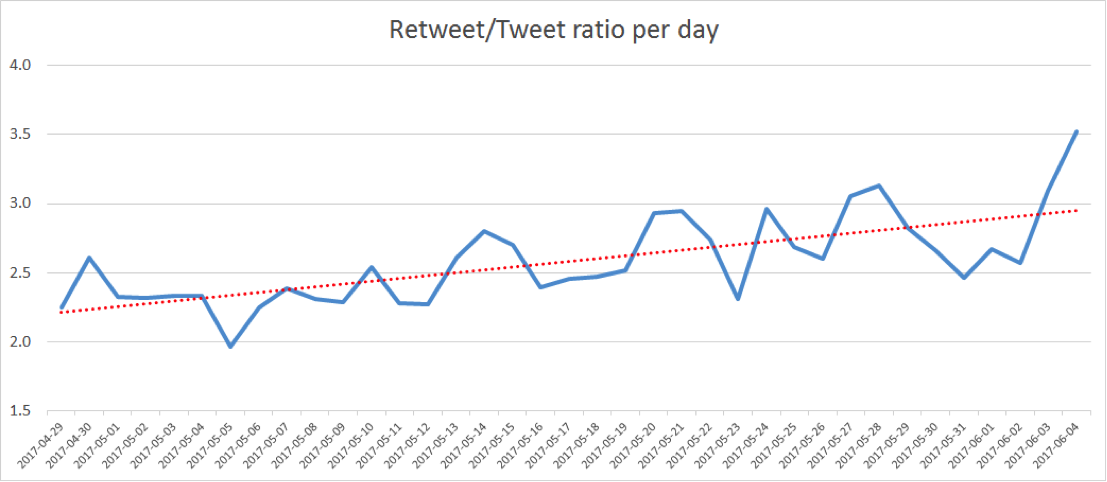
Figure 2. Relative rate of retweeting to tweeting each day. The red line indicates the linear regression or trend line (positive gradient).

Figure 2 shows the average daily retweet versus tweet rate of the election related Twitter traffic. There appears to be a steadily increasing tendency to resend and reuse existing information as the election draws closer rather than to generate novel content.

Most popular hashtags over the collection period

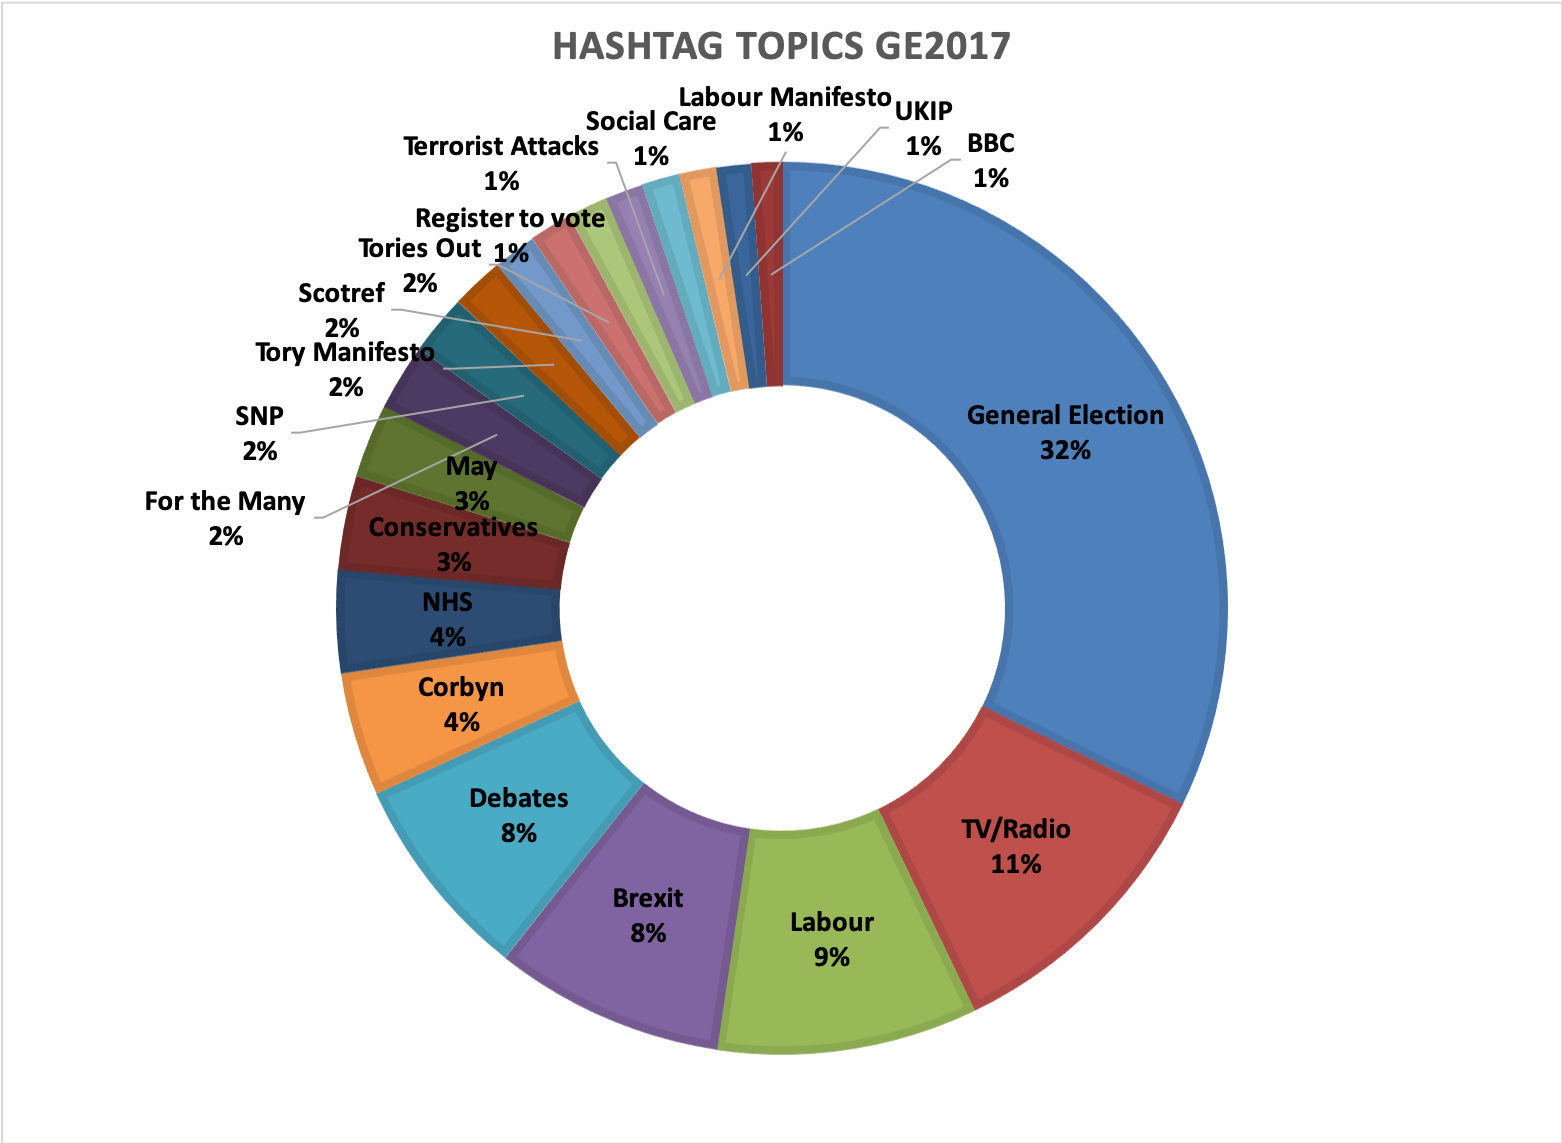
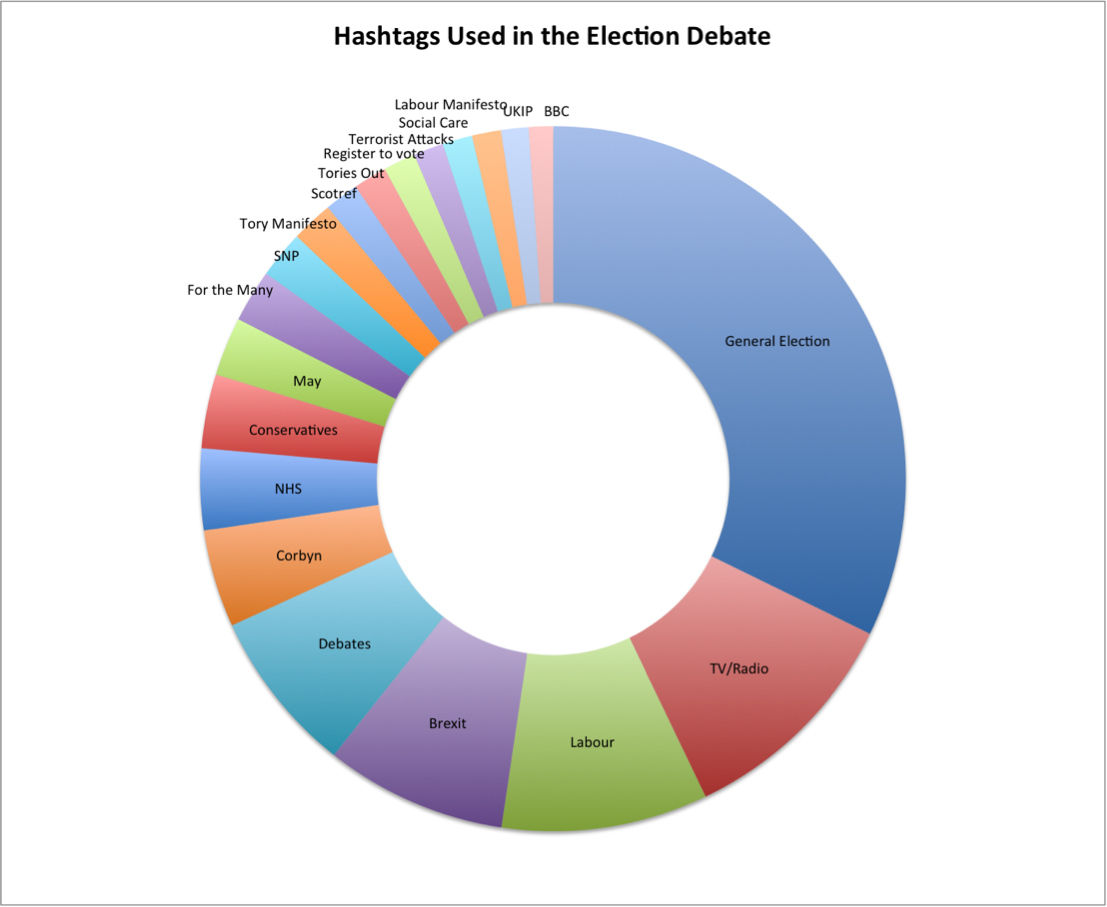
The dominant role played by broadcast-driven and promoted hashtags is clear in Table 1. Of the Top 20 categories of most employed hashtags, during the month preceding GE2017, the number two slot is occupied by those related to television and radio shows and the number five slot by the hashtags associated with the TV debates. In Figure 4, we see that these hashtags generated significant spikes, but prove ephemeral when contrasted with issues like Brexit which persisted throughout the campaign. There are very few substantive issues discussed in a sustained manner in relation to GE2017. Most of the Twitter traffic is pro or anti-leaders or political parties. However, of the issues discussed, Brexit dominates. It is the forth most common hashtag employed (935,456) in the discussion of GE2017 and is employed more than twice as often as the next issue of significance, the NHS (420,092). The only other issues to feature in the top twenty hashtags over the full collection period are the potential further Scottish referendum (176,382) and the so-called dementia tax (154,007). The appearance of the Scottish independence question as the thirteenth most common hashtag employed in the discussion of GE2017 is particularly striking, given the UK wide nature of our data collection and the likely more localised interest in this issue in Scotland. This provides an indicator of the salience of this issue to those mobilised to tweet from Scotland.

Most striking in this data set is the overwhelming dominance of Labour tweeting. Tweets using hashtags do not necessarily indicate support but do highlight areas of discussion. With over one million tweets using Labour hashtags in our data set, Labour party coverage out-performs Conservative coverage by almost three times. There are no tweets employing anti-Labour hashtags in our top twenty most used hashtags collection. There are twice as many Labour (1,062,908) as Corbyn hashtags in the tweets (503,307). However, Corbyn hashtags, in position number six, still significantly outperform May hashtags (302,494) in position number nine. The pro-Labour momentum is boosted by the widespread use of Labour-promoted hashtags such as #forthemany, #forthemanynotthefew. Despite May’s attempt to focus her campaign on her own leadership, rather than actively campaigning under the Conservative party banner, Conservative hashtags (381,647), at position number eight, marginally outrank May hashtags in the collection. Once again, however, the disproportionate presence of the Scottish National Party (SNP) in slot number eleven (244,481), given that only Scottish voters can elect this party, was striking. Interestingly it is the SNP, not the First Minister Nicola Sturgeon, that appears in the most common hashtag list. The Liberal Democrats, and their leader Tim Farron, do not figure in the top twenty hashtags. UKIP occupies slot nineteen (141,011), although Paul Nuttall does not appear.

Table 1: Top 20 Hashtag Categories Used throughout the Election Debate (the top 100 hashtags were grouped by topic and the top 20 topics selected)

Top Hashtags Grouped as Number of Hashtags
#GE2017, #GE17, #GeneralElection, #GeneralElection2017, #Election2017 General Election 3,624,566
#BBCQT, #marr, #Peston, #r4today, #NewsNight, #BBCSP, #VictoriaLIVE, #BBCDP, #WomansHour, #TheOneShow TV/Radio 1,195,880
#VoteLabour, #Labour, #ImVotingLabour Labour 1,062,908
#Brexit Brexit 935,456
#BBCDebate, #BattleForNumber10, #ITVDebate, #LeadersDebate, #MayvCorbyn Hustings / Debates 844,514
#JC4PM, #Corbyn, #JeremyCorbyn Corbyn 503,307
#NHS, #VoteNHS, #SaveOurNHS NHS 420,092
#Tories, #Tory, #conservatives, #conservatives, #VoteConservative, #conservative Conservatives 381,647
#TheresaMay, #May May 302,494
#ForTheMany, #ForTheManyNotTheFew For the Many 271,251
#voteSNP, #SNP SNP 244,481
#ToryManifesto Tory Manifesto 214,973
#ScotRef, #indyref2, #Scotland Scottish referendum 176,382
#ToriesOut Tories Out 172,380
#RegistertoVote, #Vote, #WhyVote, #Register2Vote Register to vote 165,757
#Manchester, #Londonattacks, #LondonBridge, #London Terrorist Attacks 154,497
#DementiaTax, #Socialcare Social Care 154,007
#LabourManifesto Labour Manifesto 149,731
#UKIP UKIP 141,011
#BBCElection, #BBC BBC 124,755


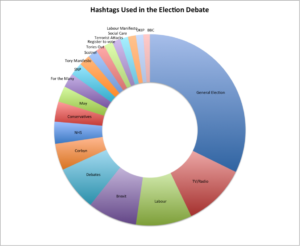
Figure 3: Percentage Share of Top 20 Hashtags Used in the Election Debate

Daily peaks in popular hashtag use

We also looked at frequency peaks of popular hashtags broken down by day over the collection period. This allows us to spot issues that may not have been tweeted about most overall but which also motivated people to comment in large numbers. The hashtags shown here appear in the top three on at least one of the days during the campaign. The event driven nature of Twitter is particularly obvious here. We can see that the largest peaks in the data come from debate-type events covered by traditional media, such as #BBCDebate, #BattleForNumber10 and #BBCQT. Similarly, other TV programmes also cause spikes in the data with #peston and #marr being particularly noticeable. We can also see that the Tory manifesto caused more of an impact that the Labour manifesto, possibly due to the leaking of the Labour manifesto, where we see two peaks of influence rather than one. We see the appearance of certain policy issues such as the so-called Dementia Tax and Fox hunting and in particular we see the sustained appearance of Brexit throughout the campaign. There are some issues which are notable by their absence as peak issues, for example the NHS and the economy. Also apparent are events that have taken place during the election campaign. Here we can see peaks of discussion of both the #NHSCyberAttack and the #LondonAttacks.

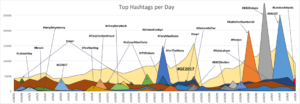
Figure 4. Hashtags that peaked on a given day on Twitter during the study period

Most mentioned and retweeted accounts over the collection period

The story of Labour dominance in the Twittersphere continues when we examine the most retweeted accounts and the accounts that get the most mentions by others. Jeremy Corbyn tops both of these lists and, though Theresa May (654,417) is the second most mentioned account, she is mentioned only half as often as Corbyn (1,367,392). The difference between the two main party accounts @uklabour (323,027) and @conservatives (307,550) is much less. Both leaders are mentioned much more often than their respective parties, perhaps confirming the presidential tenor of the campaign. Striking once again is the disproportionate presence of the SNP (145,937) and this time also their leader Nicola Sturgeon (116,360) at positions six and seven in this UK wide debate. The SNP outperforms the Liberal Democrats (93,473) and their leader Tim Farron (69,009). Scottish Conservative and Unionist Party leader, Ruth Davidson (69,334), is also mentioned marginally more often than Tim Farron. UKIP (80,855) is the tenth most mentioned account, but again Paul Nuttal does not feature. The presence of the official media accounts, and also of polling agencies like Yougov, is again a prominent feature of the most mentioned accounts in relation to the GE2017 Twitter conversation. The most retweeted accounts were again heavily pro-Labour. We also saw, as we might expect, a strong presence of the professional media and of campaign bodies here. The generation of popular memes by @laboureoin also proved to be a very effective strategy for encouraging retweets carrying a socialist message.

Table 2: Top Retweeted and Top Mentioned Twitter Accounts

Top retweeted accounts Top mentioned accounts
Account Count Account Count
@jeremycorbyn 821,499 @jeremycorbyn 1,367,392
@laboureoin 426,912 @theresa_may 654,417
@nhsmillion 342,440 @uklabour 323,027
@rachael_swindon 290,587 @conservatives 307,550
@owenjones84 224,605 @bbcnews 154,898
@socialistvoice 189,830 @thesnp 145,937
@jeremycorbyn4pm 186,269 @nicolasturgeon 116,360
@davidjo52951945 178,768 @skynews 97,287
@uklabour 171,577 @libdems 93,473
@davidschneider 164,457 @ukip 80,885
@jamesmelville 162,626 @thecanarysays 80,176
@chunkymark 161,681 @bbclaurak 77,324
@toryfibs 146,873 @ruthdavidsonmsp 69,334
@independent 139,540 @timfarron 69,009
@el4jc 119,623 @lbc 65,571
@britainelects 115,655 @yougov 62,741
@paulmasonnews 108,302 @borisjohnson 61,292
@imajsaclaimant 108,130 @guardian 58,880
@aaronbastani 101,101 @afneil 52,216
@peterstefanovi2 99,875 @johnmcdonnellmp 49,271

Daily peaks in most mentioned accounts

The top mentioned accounts were selected in the same way as the most frequent hashtags. All of these accounts appear in the top three most mentioned on at least one of the days during the campaign. Here we can see that @jeremycorbyn has been mentioned much more frequently than @theresamay throughout the campaign. We see three political parties mentioned; @conservatives, @uklabour and surprisingly again @theSNP. We can see how events shape peaks with the single peak in mentions for the Scottish Conservative and Unionist Party leader @ruthdavidsonmsp reflecting her announcement of a u-turn on prescription charges in Scotland. We can also see the influence of journalists here with @krishgm, @bbclaurak and @afneil.

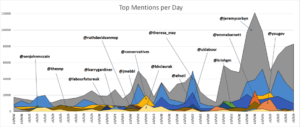
Figure 5. Mentions that peaked on a given day on Twitter during the study period

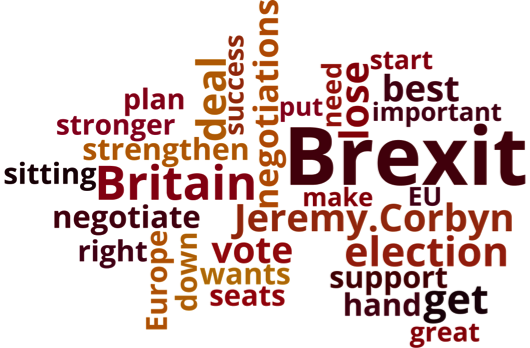
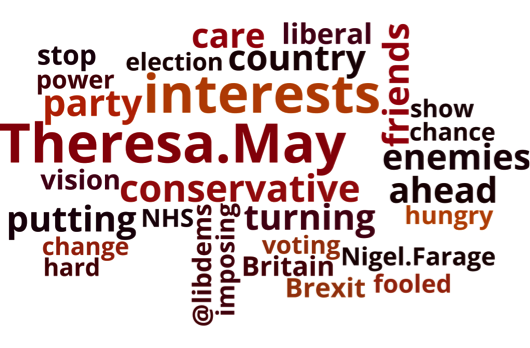
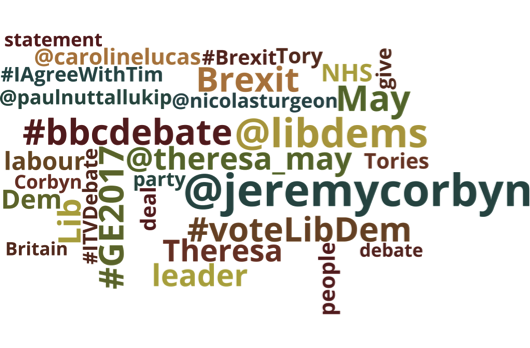
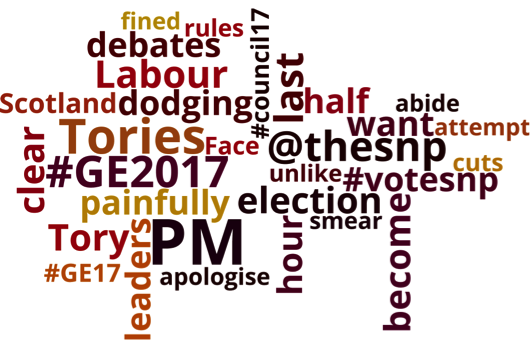
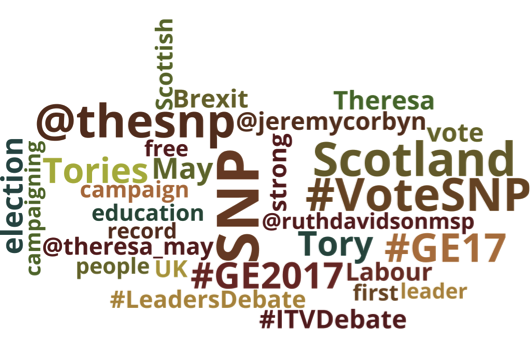
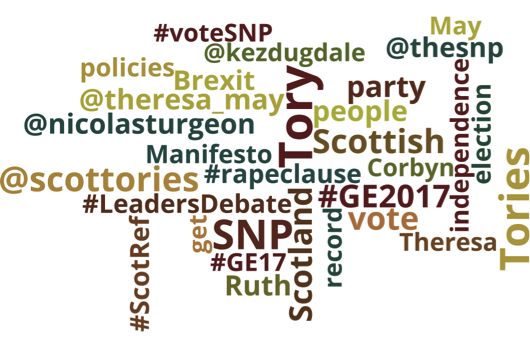
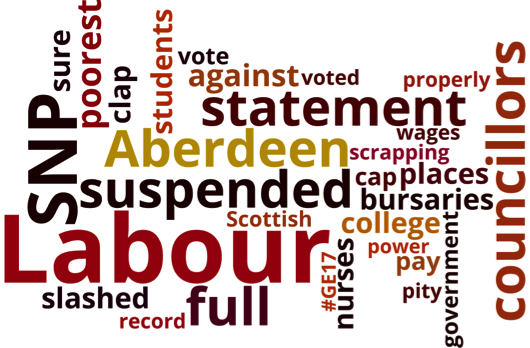
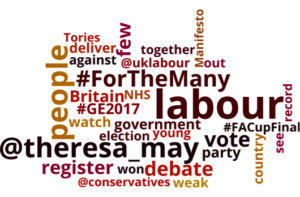
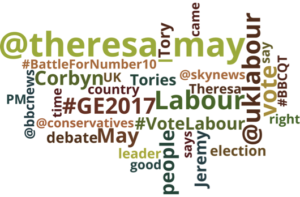
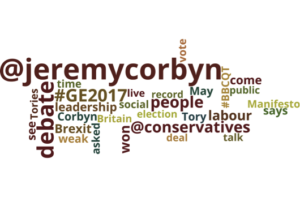
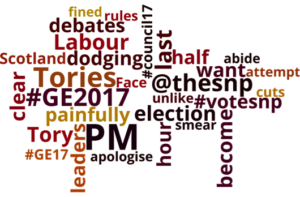
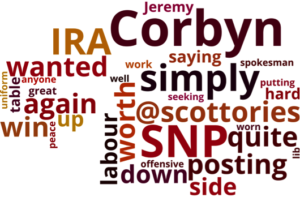
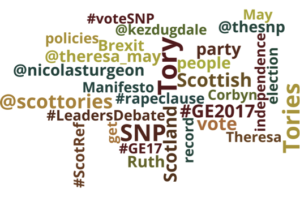
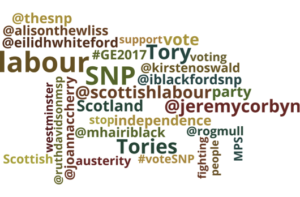
Most mentioned topics by and linked to politicians

We checked the most frequent terms used by key politicians themselves and we compare these with the most frequent terms used by others when mentioning these politicians. We can consider the terms used by the politicians as their attempts to influence debate and to set the agenda. This cloud reflects what the politicians want to talk about. The terms in the tweets from others mentioning the politicians can be considered to be the topics that Twitter users are trying to direct towards the politicians, these clouds reflect the agenda that Twitter users are associating with that politician.

In the visualisations you can see the terms side by side for each politician. There are several things that can be observed:

  • Jeremy Corbyn is the only politician that directly challenges another politician – we can see this through the use of @theresamay. The other politicians do mention other leaders but they do not use specific @ mentions to interact with them;
  • Theresa May and Tim Farron do not mention their parties often;
  • Ruth Davidson who is often associated with distancing herself from the Scottish Tory brand actually tweets about her party quite often;
  • Whereas Theresa May often tweets about Brexit this is not echoed in the tweets of those that mention her;
  • Brexit does occur in the tweets mentioning Tim Farron, Nicola Sturgeon and Ruth Davidson;
  • None of the Scottish leaders tweet heavily about independence but those tweeting about Kezia Dugdale and Ruth Davidson associate both of them heavily with this debate;
  • Nicola Sturgeon, heavily associated in the traditional media with Scottish independence, is not associated with this by those mentioning her or seeking to interact with her on Twitter;
  • The debates feature heavily in the tweets mentioning politicians except for Kezia Dugdale;
  • Jeremy Corbyn and Nicola Sturgeon make most sophisticated use of Twitter devices such as hashtags and @ mentions.


Account own tweets Tweets mentioning the account
Jeremy Corbyn

Jeremy Corbyn

Theresa May

Theresa May

Tim Farron

Tim Farron

Nicola Sturgeon

Nicola Sturgeon

Ruth Davidson

Ruth Davidson

Kezia Dugdale

Kezia Dugdale

Figure 6: Most frequent terms employed by key politicians v the most frequent terms used by others when mentioning these politicians.

Discussion and Conclusions

In this study, we applied a quantitative analysis to the Twitter posts on the British general elections 2017 during the month period preceding the election. Our analysis included a set of around 35 million tweets on the topic. Here we present a preliminary exploratory analysis of this data set. Twitter analysis has strengths and weaknesses. Twitter users are not representative of the wider public – they are self-selected users not those chosen on the basis of careful sampling by opinion pollsters. Twitter users tend to be highly motivated (with an axe to grind), younger than average (though not exclusively young) [1] and are likely more often men [2] when engaged in political debate. So any insights are partial. That said, Twitter can be a reflection of spontaneous, motivated behaviour. Analysing Twitter narratives helps us to see where those highly motivated individuals position themselves in relation to the debate, what appears to provoke peaks in motivated activity and also what the overall trends are in these vocal and active publics. It also helps us to explore who sets agendas and shapes conversations in the Twittersphere and how effective or ephemeral these narratives are.

Events played a key role is shaping the Twitter conversation. These events can take many forms, election-specific events such as the debates, media events such as television and radio programs and physical events such as the NHS cyber attack and terrorist attacks. Twitter does not exist in a vacuum and the conversation that occurs there is often prompted by external events.

Researchers at the Centre for Research in Communication and Culture (CRCC) at Loughborough University have studied media coverage of the election campaigns over two weeks, 18th – 31st May. They analysed discussion in television news and print media. They observed that in the first week, starting on the 18th May, the Conservatives and Theresa May receive more coverage than Labour and Jeremy Corbyn. In contrast, we find that the social media discussion during this time was focused on Labour and Corbyn. The second week saw a rise in the traditional media coverage of the Labour party which was slightly more than the Conservatives. This rise was for the most part driven by increased traditional media coverage of Jeremy Corbyn bringing this more in line with the social media data. The Loughborough data also shows a high prevalence of Scottish MSP’s with Nicola Sturgeon and Ruth Davidson both appearing in the top 10. This is mirrored in our social media data set.

In the last week of May the top five most prominent issues seen in television and print media were the electoral process, Brexit, health care, taxation and the economy/business. We can see this echoed to some extent in the social media data, with the manifestos, Brexit, and the NHS. We do not see the appearance of taxation, the economy or business issues.

Our data set shows an overwhelming dominance of pro-Labour tweeting. With over 1 million tweets using Labour hashtags, Labour party coverage out-performs pro-Conservative coverage by almost three times. There is a disproportionate presence of the SNP in this social media set and given that only Scottish voters can elect this party this was particularly striking. These three observations were also noted in a week long study (1-7th May) conducted by researchers at the Oxford University’s Internet Institute [4].

It is important not to exaggerate the novelty of new social media. New media to some extent appears to be simply an extension of old media and we see in our data set how broadcast media often generates additional coverage by effectively reporting on itself. Key bursts in Twitter throughout the GE2017 campaign came from people using hashtags associated with TV debates and programmes like Question Time. These hashtags are created by the programme makers and die off almost immediately. This is not surprising as they are instantaneous or throw-away hashtags associated with a specific programme. It would be difficult to claim that these had any significant role in setting a political agenda or in shaping debates, rather they act as a means of tracking who was watching and engaging with the particular media generated events.

Twitter is of course not representative of the voting public as a whole, and therefore not necessarily a clear reflection of “the many, not the few”. However, whilst Twitter cannot be used to predict elections and the overwhelming support we see for Labour and Jeremy Corbyn may not be fully reflected in the ballot boxes, it is a useful tool in giving us the mood of those who are motivated enough to comment in social media. Tweeters are typically highly motivated and perhaps those who initially see themselves as the underdogs in the debate, excluded from mainstream coverage. This has been apparent in a number of recent campaigns. The YES campaign, though ultimately unsuccessful, dominated social media in the Scottish independence referendum. Leave groups did the same in the 2016 Brexit campaign and Trump’s dominance in social media transformed US election coverage, with both these campaigns ultimately triumphing at the polls. As the Loughborough study shows, Corbyn’s campaign did not initially enjoy the access to the traditional media that May was afforded [3]. This may explain the surge in social media activity which subsequently developed a life of its own and has ultimately had to be acknowledged by the mainstream media. This also fits with the high presence of the SNP in our data set, with the Scottish debate marginalised at the UK level. If the current polling is to be believed Jeremy Corbyn is unlikely to do as badly as was anticipated when the election was first called. Traditional media sources were slow to pick up on this change in public opinion whereas this trend could be seen early on in social media and throughout the month of May.

References

[1]http://journals.plos.org/plosone/article?id=10.1371/journal.pone.0115545

[2]http://www.bbc.co.uk/news/blogs-trending-32137886

[3]http://blog.lboro.ac.uk/crcc/general-election/media-coverage-of-the-2017-general-election-campaign-report-3/?utm_source=Twitter&utm_campaign=ge2017&utm_content=coverage#coverage

[4]http://www.ox.ac.uk/news/2017-05-31-labour-dominating-twitter-conversation-uk-election-campaign-says-study

This work was produced by:

Laura Cram, Clare Llewellyn, Robin Hill Neuropolitics Research Lab
School of Political and Social Science University of Edinburgh {laura.cram, c.a.llewellyn, r.l.hill}@ed.ac.uk

Walid Magdy
Institute for Language, Cognition & Computation School of Informatics
University of Edinburgh wmagdy@inf.ed.ac.uk

1st psychology group meeting of SINAPSE was held

The first psychology group meeting of SINAPSE (Scottish Imaging Network: A Platform for Scientific Excellence) was held on 16th Jan 2017 at the University of St. Andrews. This informal friendly meeting was very successful to network senior researchers, early career researchers, and postgraduate students, who brought various promising research topics to the meeting, including Neuropolitics research.   Nice walking along the beach, the attendees introduced themselves to each other, exchanged ideas, and discussed the future direction of this group meeting. It is such an exciting time that neuroimagers in the research fields of psychology and cognitive neuroscience in Scotland would get together with strong motivations to promoting collaboration and sharing research experiences and opportunities.

http://www.sinapse.ac.uk/news/1st-meeting-of-the-sinapse-psychology-group


New techniques for new technologies

I want to believe (X-Files classic)Modern digital methods of communication have become highly diverse, paradoxically making the exchange of information both easier and more complex.  Critically, there is no longer a single canonical format for conveying written information or engaging in direct spoken communication.  Handwritten or standard typeface letters have been replaced by instant, informal streams of data; often broadcast not to a single recipient but to multiple family members simultaneously, groups of friends, or simply any of the billions of people out there.  Fonts, colours, layout and accompanying images can all carry meta-linguistic connotations, altering how words are perceived and understood.  Choice and style are much more pervasive.  Phones are no longer limited to simple speech and inhibited by physical wires; instead, they are mobile, multisensory devices with integrated cameras and a range of sensors generating constant data about the user, details of which can be automatically incorporated as an additional communication channel.  Semiotics has become much more explicit, exaggerated and directly visual in nature.  Accessible technology is now a global reality that transcends cultural boundaries.  Semantics and context have to be established in 140 characters or less.  All these fast-moving changes permit a rich and exponentially growing complexity in human interaction.  However, this rapid shift in communication behaviour, both in terms of production and comprehension, means there is still little understanding of how the different modalities interact to deliver an intended, or unintended, message.  This is particularly true when information has to be evaluated in terms of unknown or ambiguous provenance and authenticity.  In other words, do you believe it? Do you trust it? Do you agree with it?  What combination of factors will make you re-read, re-post, re-Tweet, or even just reply/comment rather than ignore?  The Art of Persuasion has become a highly scientific pursuit with significant social and political impact.  Why are we apparently living in a post-fact world?  Is this trend just a natural and inevitable consequence of current attitudes and beliefs?  Not only are some facts more equal than others, but some may not be facts at all. Robert Proctor (Stanford University) has spent many years investigating the spread of ignorance and created the wonderful word “agnotology”.  This is typically defined along the lines of “culturally constructed ignorance, purposefully created by special interest groups working hard to create confusion and suppress the truth”.  Of course this term in itself could be construed to have a certain negative sentiment and over-critical discourse bias.  Fortunately, the subtitle of his co-edited book on the matter does emphasis the unmaking as well as making of ignorance, but the technologies and tools to make or break agnotology have already changed dramatically in the few years since it was published.

Investigating the process of how trust is established, examining the reliability and uptake of information, and determining the level of data quality is (I considered “lies”) at the heart of our neuropolitics research.  This covers more implicit and subtle manipulations as well as direct, explicit presentation.  Faith in evidence is required, even if faith is not commonly associated with science.  Similarly, the change in the types of data being analysed means that new techniques have to be developed, applied and constantly reviewed, requiring a fully agile approach.  Testing and validating a methodology is more important than any single dataset.  Outside of academia, data journalism has emerged as a term associated with objective and unbiased data transparency.  This includes a global growth in fact-checking websites, with examples such as fullfact.org in the UK.  Whether this represents a return swing away from current anti-expert attitudes to a more evidence-based approach remains to be seen.

[Proctor, R., & Schiebinger, L. L. (Eds.). (2008). Agnotology: The making and unmaking of ignorance. Stanford University Press.]

Everything is Up for Grabs in Brexit Process

Just as with the other existing models – Norway, Switzerland, Canada, Greenland – the new British relationship with the EU will have to be purpose built. If Scotland is to maximise its advantage in that process, says Laura Cram, it will need to be out of the blocks before the Article 50 starting pistol is fired. 

No-one knows precisely when the Article 50 process, formally notifying the intention of the UK to leave the EU, will be triggered. But being prepared is essential not just to respond swiftly but to shape the direction the subsequent negotiations take. We know only that the clock is ticking but not when the alarm is set to go off. The challenge for Michael Russell, as the Scottish Government’s new Brexit Minister, will be to re-shape the boundaries of the possible in Scottish-UK-EU relations before the Article 50 process begins.

As every returning Olympian will testify, responding to the sound of the starter’s gun comes at the end of an intense and lengthy process of physical and psychological preparation, scenario planning, sizing up the opposition and understanding the nature of the terrain. Not everything is within an athlete’s control, but a successful Olympian will have prepared for what they can and will be aware of where the uncontrollable might surface. They will have thought through what action to take and how to both create and to seize opportunities. Carefully constructed teams of experts support their efforts. Control of the race is key and preparation is key to control. To fail to prepare, in high stake games, is to prepare to fail.

Writing in the 1970s Ernst Haas, one of the earliest scholars of European integration, described the scenario in which a very large number of organisational actors find themselves with confused and clashing perceptions of the optimal solutions to the problems they face as a “turbulent policy field”. Actors pursue mutually incompatible objectives and are unsure of the trade-offs between these objectives. At the same time these actors need to cooperate with each other as they are tied into a network of interdependencies. Haas describes this scenario as being like a “giant simultaneous chess match over which the judges have lost control”. Confusion and uncertainty are dominant in a turbulent decision field and this confusion can be sub-national, national, supra-national and global all at the same time.

The Brexit process is just such a turbulent field. Beyond the formalities of the legal process, laid out but as yet untested in Article 50, we have no precedent to draw on. It is even controversial at EU level which EU institution will lead the negotiations. Within the UK, different territorial perspectives prevail. Uncertainty creates a suboptimal decision environment. Uncertainty produces a tendency to cling to the status quo, and when there is no status quo to cling to – a tendency towards delay and indecision. This is a tendency to be resisted at all costs.

Talk of existing models – Norway, Swiss, Canadian, Greenland – as templates for Brexit are examples of such status quo bias. Until these models were developed none of them existed. There is no UK model or rUK model for non-member state relations with the EU only because it has not yet been imagined or constructed. None of the existing templates were created for departing member states or for non-departing territories within departing member states. The flip side of a turbulent policy field, according to Haas, is that “everything is up for grabs”. A turbulent field is also an optimal environment for creative thinking and bold policy entrepreneurship. The trick is to be the one shaping the options and framing the ensuing debate.

Policy studies consistently show that the most effective moment for agenda-setting is when an idea is not yet a spark in policy-makers’ eyes. The persuasive power of solid policy analysis and clear scenario planning has the potential to frame the debates that ensue. The earlier that clear alternative scenarios are developed, the more time there is to normalize these ideas with other decision-makers within the UK and across the EU. Softening up the decision environment by exposing new scenarios to decision partners, until they don’t seem so new, radical or threatening is key. Pro-actively framing the debate and shaping the negotiations, in a time-sensitive environment, is crucial. Clear scenarios for what Scotland wants in relation to EU and UK membership in the case of a hard or soft UK-wide Brexit, or in the case of an independent relationship with the EU, need to be developed, disseminated and normalized in the debate without delay.

It is the UK Government that will fire the starter’s gun at what is considered to be an optimal time for them. That may not coincide with Scotland’s preference or interests. Jumping the gun will be an Olympian effort but the Scottish Government is no stranger to this.

This article was written by Laura Cram of the Neuropolitics Research Lab from the University of Edinburgh. It is re-blogged from the the Centre for Constitutional Change’s blog. It was originally co-published with the Herald